Metric threshold
An Agent Serve Metric threshold compares a governed metric with a value and fires when it crosses the line.
Pipeline coverage < 3.0
Agent Serve · Monitors
Monitors watch the metrics that matter. When one crosses its line, the alert reaches your team and a Relay can start the follow-up.
Agent Serve Monitors watch important metrics and conditions in Agent Serve, the AI workspace where teams build, deploy, and manage AI agents. Monitors check a governed metric against a threshold, count the rows that match a rule, or follow a dashboard KPI card, and a Relay can start work when a monitor alerts.
How it works
An Agent Serve monitor is a condition, a check frequency and a severity. It runs on its own until you pause it.
Pick a governed metric for a Metric threshold, or a rule and a table for a Rule match.
Compare the metric with a value using >, ≥, <, ≤, = or ≠, or set how many rows must match the rule.
Check every 5 minutes, every 15 minutes, hourly, every 6 hours or daily, and mark the alert Info, Warning or Critical.
The alert lands on the Alerts tab, and a Relay set to run when a monitor alerts picks up the follow-up.
Three kinds
An Agent Serve Metric threshold compares a governed metric with a value and fires when it crosses the line.
Pipeline coverage < 3.0
An Agent Serve Rule match fires when at least the number of rows you set in a table match a rule.
≥ 5 rows match “AML threshold”
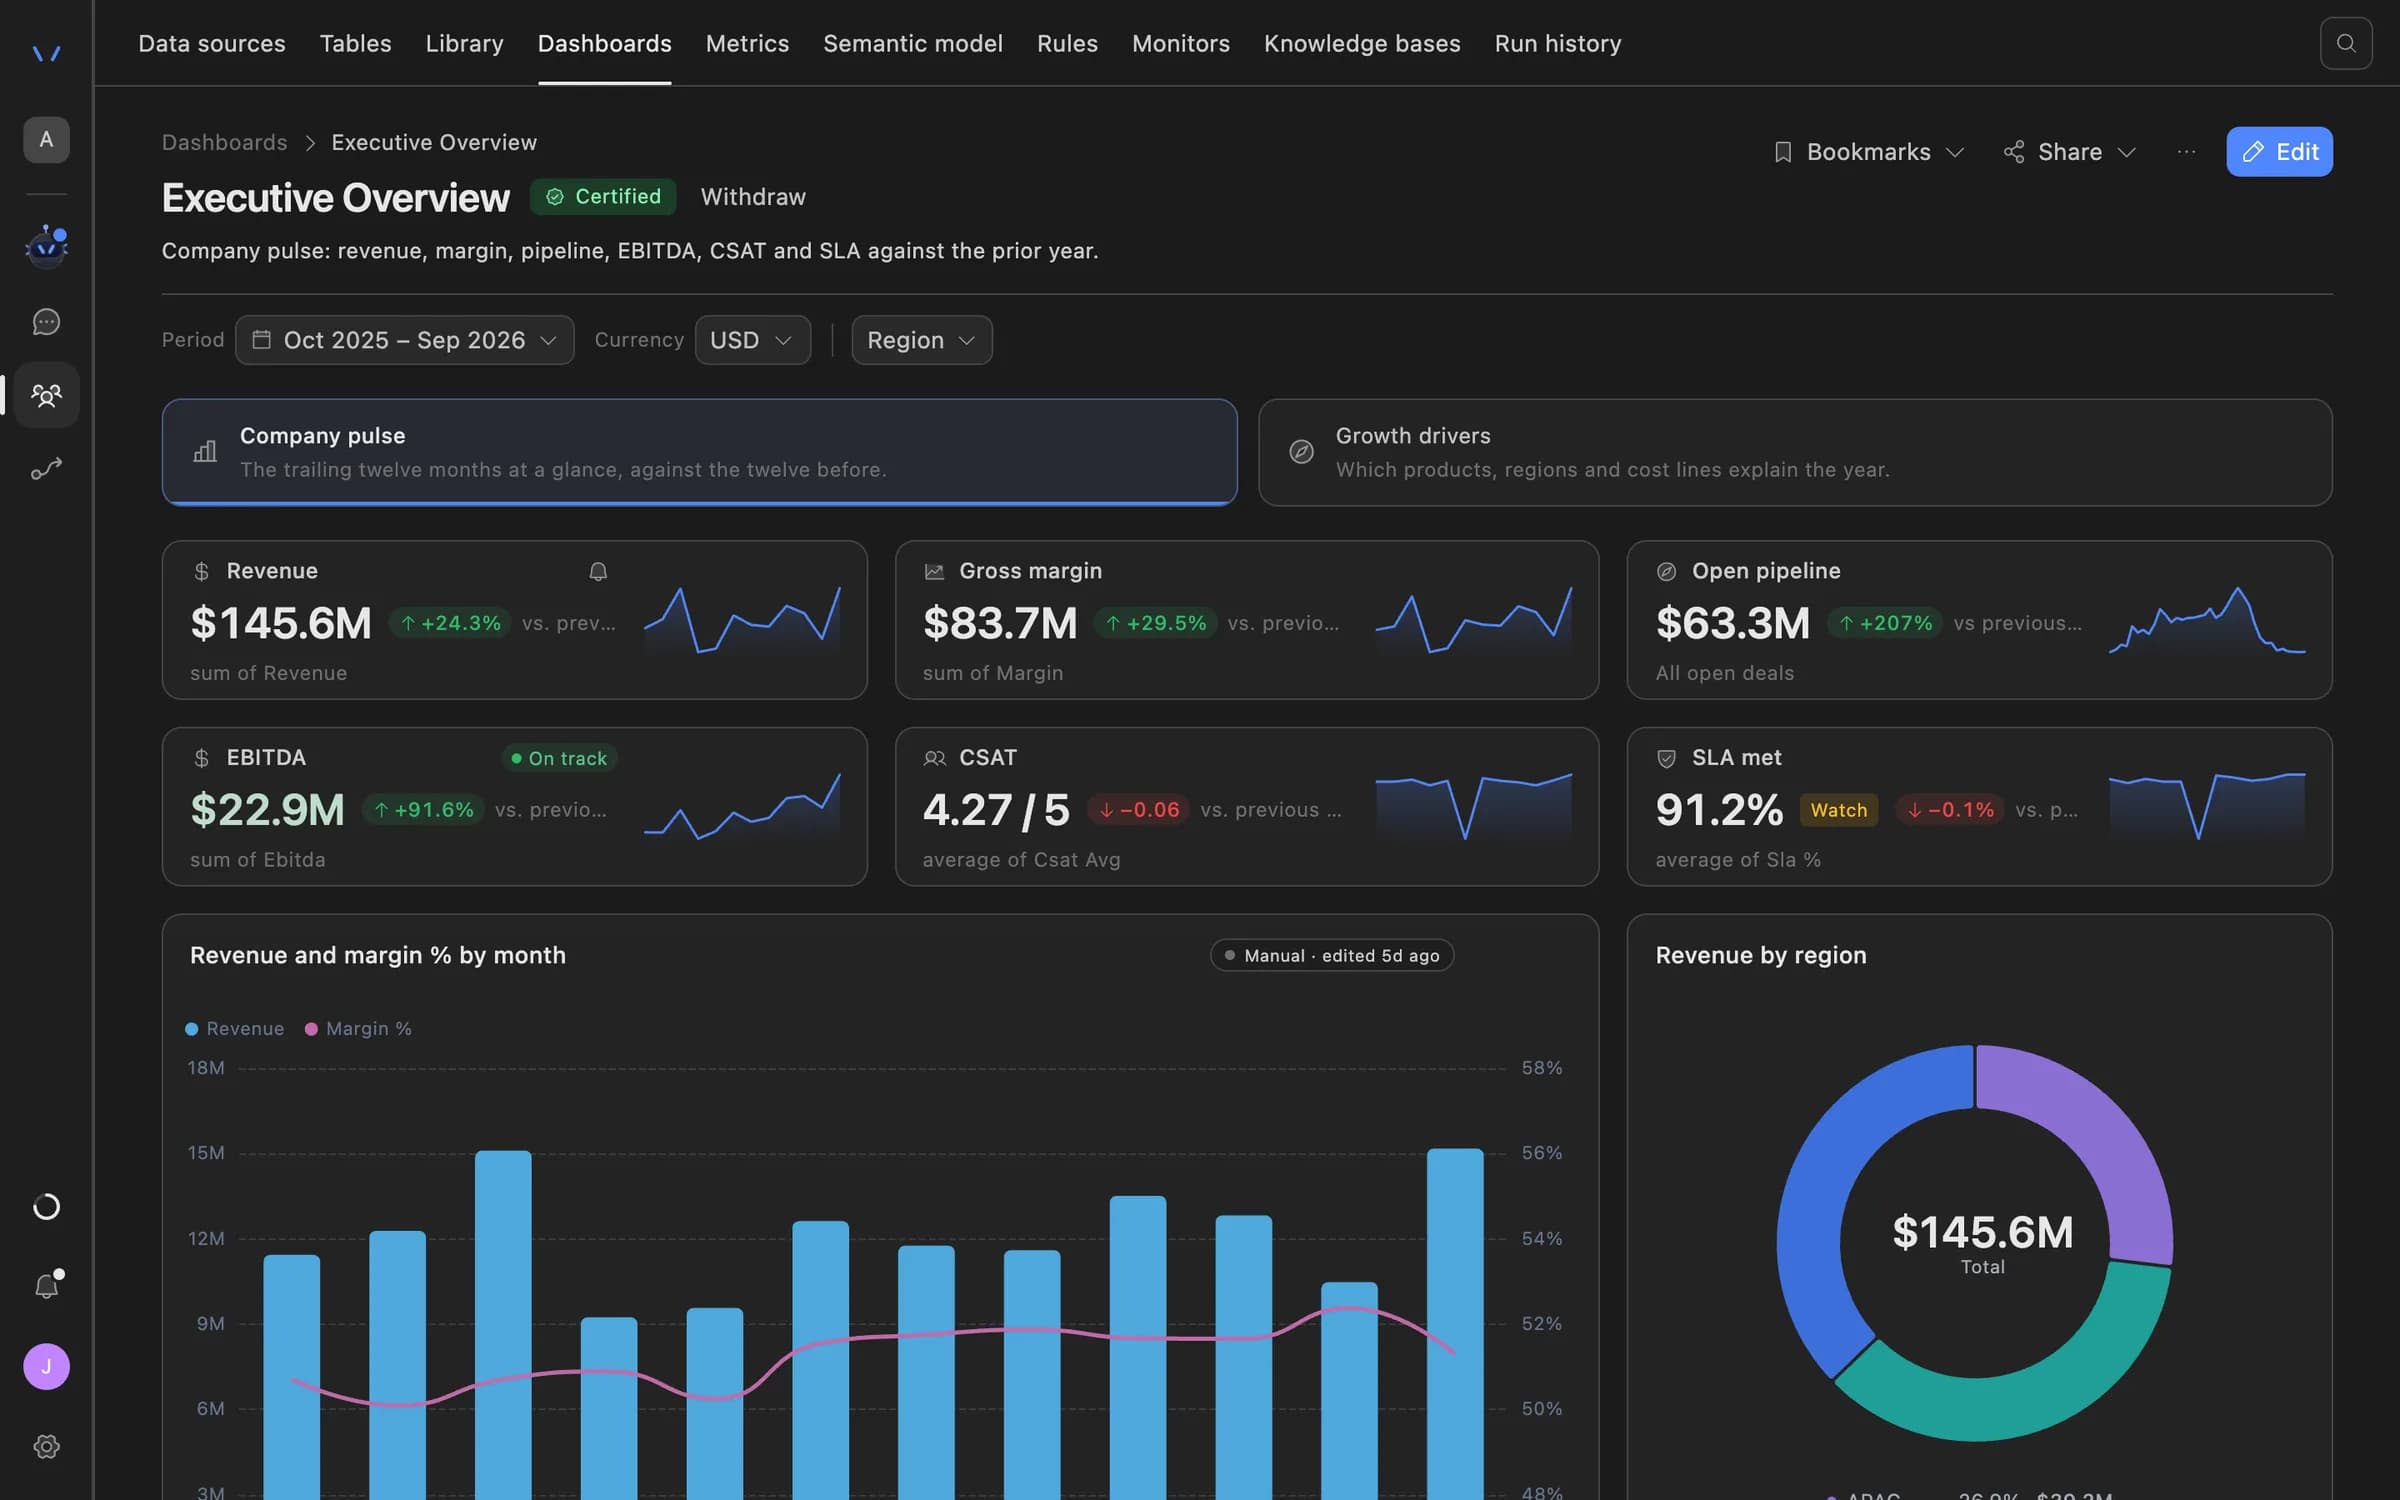
Choose New KPI alert on an Agent Serve dashboard card and alert when it goes above, drops below or changes by a percentage.
NPS drops below 40
Every Agent Serve monitor raises its alerts as Info, Warning or Critical, and the Alerts tab filters by severity.
Critical · Warning · Info
The Agent Serve Monitors tab shows each monitor as Active, Firing or Paused, with its target and owner.
12 monitors · 2 firing
Agent Serve alerts stay Open until they are resolved, so the Alerts tab doubles as the follow-up list.
Open · Resolved · All alerts
In motion
A Rule match uses the same rule your dashboards use, so the alert and the analysis agree on what “at risk” means.
A Relay with ongoing work set to When a monitor alerts reads the records behind the alert and drafts an explanation.
KPI-card alerts are created on the dashboard itself, and editing one opens that dashboard.
Under the hood
| Monitor kinds | Metric threshold, Rule match, and KPI-card alerts created from a dashboard. |
|---|---|
| Comparisons | >, ≥, <, ≤, = and ≠ against a value you set. |
| KPI-card conditions | Goes above, Drops below, or Changes by a percentage since the last check. |
| Check frequency | Every 5 minutes, Every 15 minutes, Hourly, Every 6 hours or Daily. |
| Severity | Info, Warning or Critical. |
| Notifications | In-app on the Alerts tab, always. Email me for KPI-card alerts. Slack through a workspace alert webhook. |
| Limit | Up to 200 monitors per workspace. |
| Hand-off | Relays can run ongoing work When a monitor alerts. |
Examples
Three monitors financial services teams set up in Agent Serve, each one a check someone used to run by hand.
An Agent Serve Metric threshold checks seven-day deposit outflows every hour and raises a Critical alert above the limit.
An Agent Serve Rule match counts transactions that meet the AML threshold rule and alerts once enough rows match.
A regional head sets an Agent Serve KPI-card alert on branch NPS and gets an email when it drops below the target.
Examples show what teams can build in Agent Serve. They describe patterns, not named customer deployments.
By the numbers
3
Monitor kinds: metric, rule and KPI card
3
Severities: Info, Warning and Critical
5 min
Shortest check frequency
200
Monitors per workspace
Before and after
| Work | Before | With Agent Serve |
|---|---|---|
| Spotting a change | BeforeSomeone opens a report each morning and hopes to notice. | With Agent ServeAn Agent Serve monitor checks on schedule and raises an alert. |
| Definitions | BeforeThe alert and the report disagree on what “breached” means. | With Agent ServeMonitors read the same governed metrics and rules as dashboards. |
| The follow-up | BeforeAn email thread asking who will look into it. | With Agent ServeA Relay starts the investigation when the monitor alerts. |
| Knowing what is open | BeforeAlerts scattered across inboxes and chat channels. | With Agent ServeOne Alerts tab, filtered by severity, Open or Resolved. |
Governance
Agent Serve evaluates KPI alerts with the owner’s data access and keeps every alert inside the workspace first.
Security and governanceAgent Serve evaluates a KPI-card alert with its owner’s data access, so an alert never reads rows its owner cannot see.
Every Agent Serve alert is recorded on the Alerts tab. Slack delivery only happens when a workspace alert webhook is set.
Row-level policies narrow what each person sees in tables, dashboards, exports and scheduled reports.
Admin, write and read roles per workspace, plus permission groups that limit which models, blocks and integrations a team can use.
Sign in through your identity provider with SAML 2.0 or OIDC, and provision people with SCIM.
Run Agent Serve in your own cloud or data centre, next to the systems it reads.
Works with
Create a KPI-card alert straight from a dashboard card.
Use a rule in a Rule match to count the rows that need attention.
Watch formula metrics that resolve measures from the semantic model.
Run a Rule match over any workspace table.
Start a Relay’s ongoing work When a monitor alerts.
Further reading
Disputes that fail reconciliation tend to sit in a side queue until the chargeback window has closed. Here is an end-to-end setup that finds them early, ranks them by deadline and drafts the pack, with an analyst signing every filing.
Cards and payments operations · 12 min readPeriodic reviews pile up because every file starts from scratch, even when nothing has changed. Here is a setup that refreshes the data, drafts the file and routes it by risk, so analysts spend their time on the reviews that need judgement.
Retail and business banking · 12 min readSampled call reviews find a missing risk warning weeks after the client acted on the advice. Here is a setup that checks every recorded advice call within a day and puts the quote in front of a compliance reviewer.
Wealth and advice · 12 min readQuestions
Dashboard KPI-card alerts live in Agent Serve Monitors beside metric and rule monitors. Editing one opens the dashboard it was created on.
Yes. An Agent Serve Relay can run ongoing work When a monitor alerts, and its result lands in the Relay’s task list for review.
Every Agent Serve alert appears in-app on the Alerts tab. KPI-card alerts can also email you, and alerts can go to Slack through a workspace alert webhook.
Agent Serve monitors check every 5 minutes, every 15 minutes, hourly, every 6 hours or daily, chosen per monitor.
Not today. Agent Serve monitors fire on a threshold you set, a rule match count, or a KPI-card condition, so every alert has a stated reason.
Last updated
Enterprise access
Agent Serve is available to teams by invitation. Tell us what you want to build and we will set up your workspace with you.