Agent Serve · Dashboards

A clearer view. A better next move.

Interactive dashboards on shared metrics. Filter, drill from a headline number to its records, and share with exactly the right people.

Agent Serve Dashboards is the BI module of Agent Serve, the AI workspace where teams build, deploy, and manage AI agents. Dashboards use governed metrics from the semantic model, connected filters, drill-through, workbench scenarios, row-level security, version history and controlled sharing.

How it works

From a template to a report in inboxes.

Agent Serve Dashboards starts from a template or a sentence, and ends as a shared link or a scheduled report.

  1. 1

    Start from a template

    Pick one of nine templates, such as Executive overview or Pipeline tracking, or start from a blank grid.

  2. 2

    Describe a panel

    Describe the chart you want and choose from up to four proposals, built on your governed metrics.

  3. 3

    Connect the filters

    Add date, select, top N or hierarchy filters, or type a filter in plain words in the AI filter box.

  4. 4

    Share or subscribe

    Publish a viewer link with an audience and expiry, or schedule a PDF to arrive daily, weekly or monthly.

In depth

Built for the questions after the headline.

Agent Serve Dashboards covers executive views, forecasts, what-if work and call compliance on the same governed data.

01 · Executive views

One set of definitions

Agent Serve panels reference governed metrics instead of copying formulas, so revenue, margin and service levels agree on every view.

  • Compare with the previous period or the same period last year
  • Annotate a point, a range or a whole panel
  • Explain chart writes a short narrative of what changed
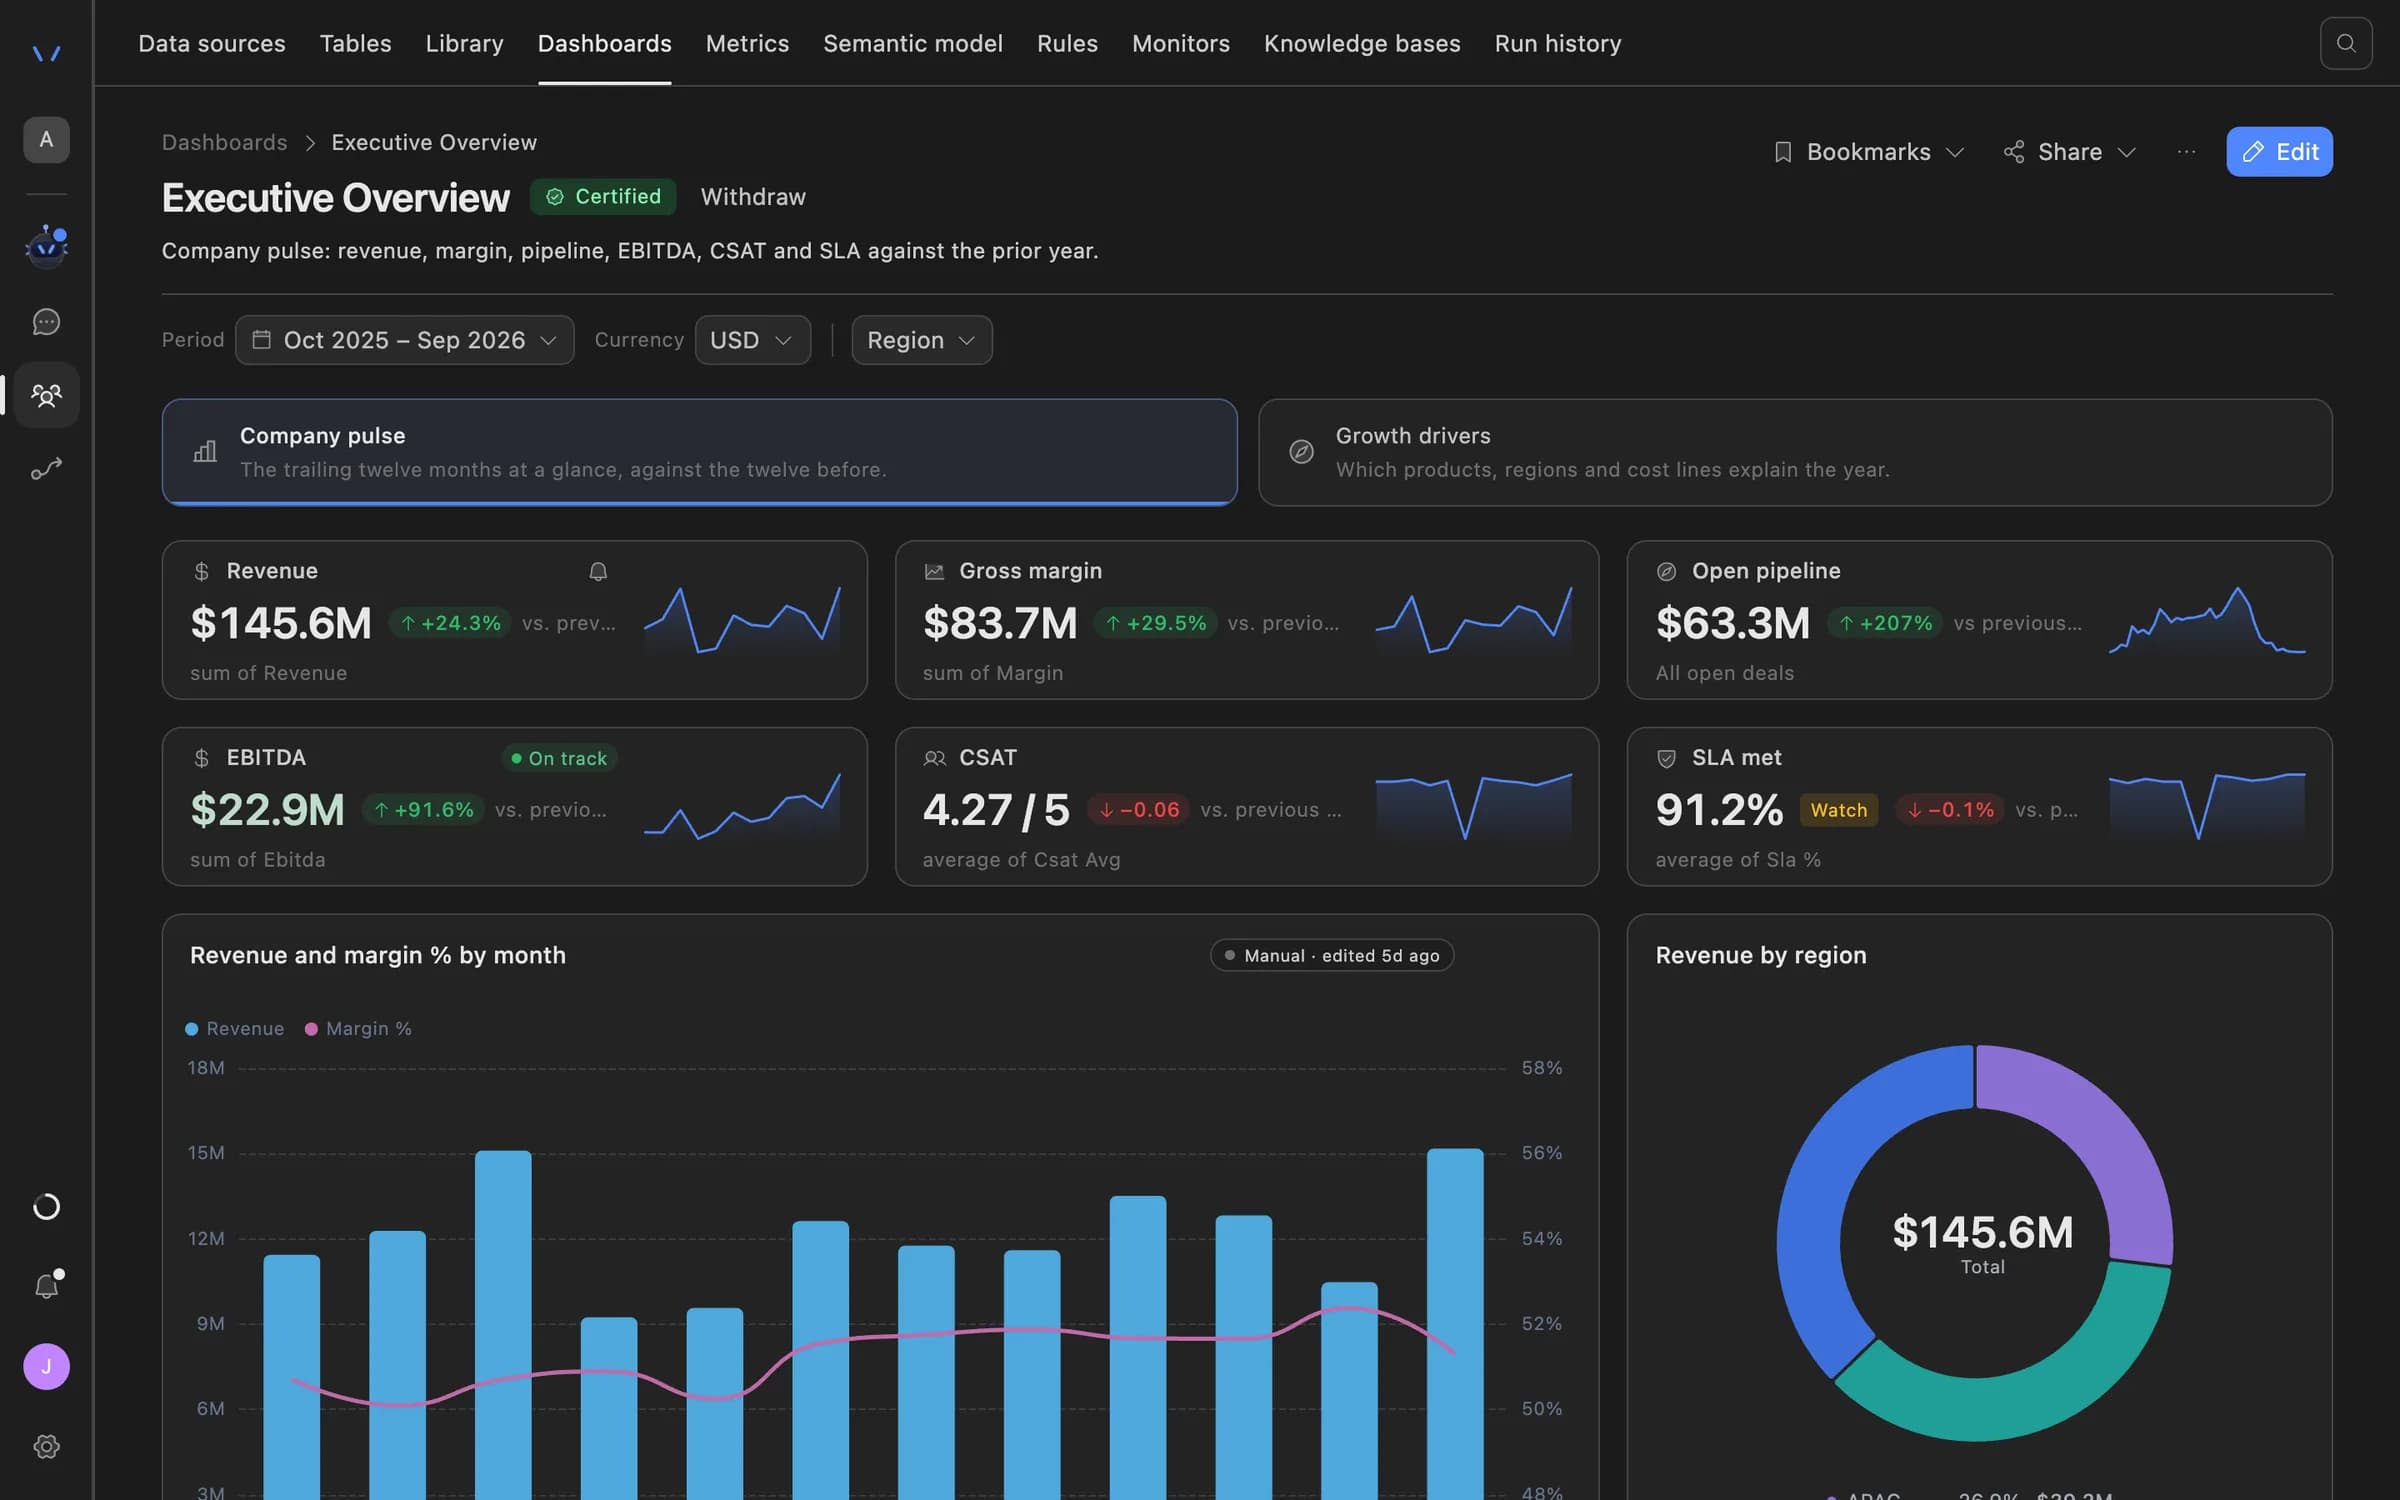
Agent Serve dashboard showing an executive overview: revenue, gross margin, open pipeline, EBITDA, CSAT and SLA tiles with trend lines, a monthly revenue and margin chart, and revenue by region.
02 · Drill

From the total to the rows

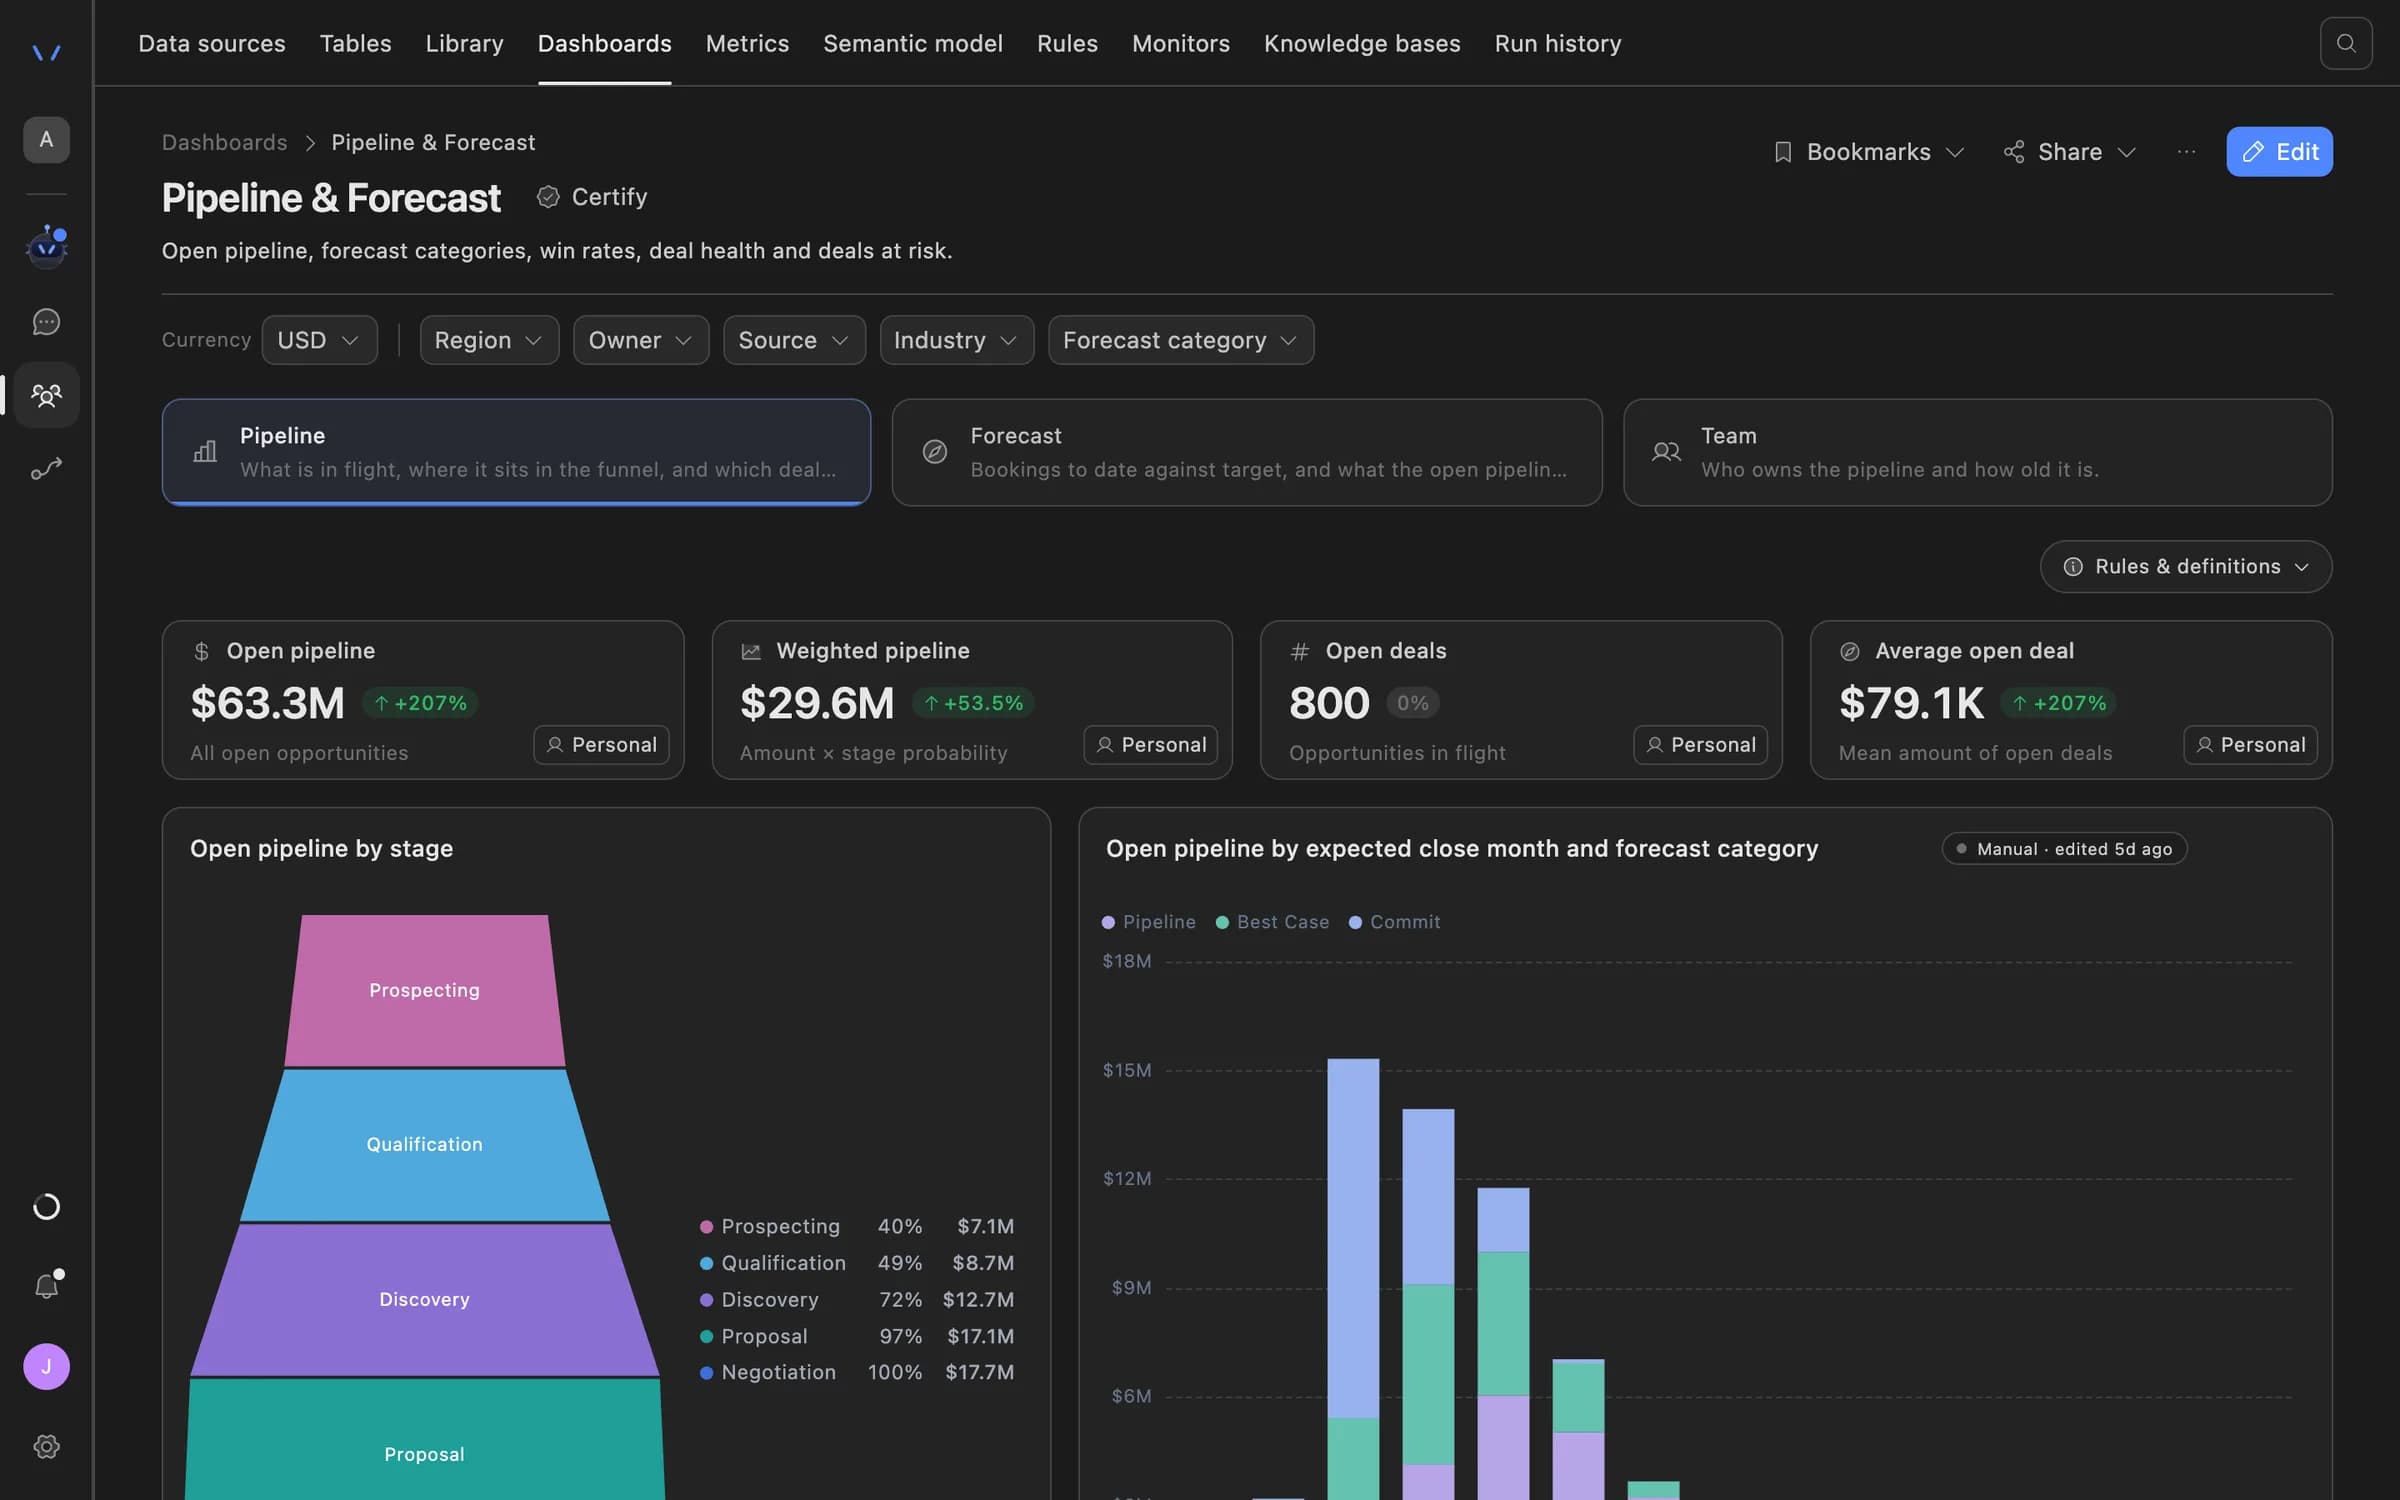
Drill down and back up through as many as six levels in Agent Serve, with breadcrumbs, then open See rows for the records behind a value.

  • Go to view drills through to another view
  • Breadcrumbs show the path you took
  • Export the rows behind a panel as CSV
Agent Serve Pipeline and Forecast dashboard with open and weighted pipeline tiles, a funnel by stage, and pipeline by expected close month and forecast category.
03 · Scenarios

What-if, kept apart

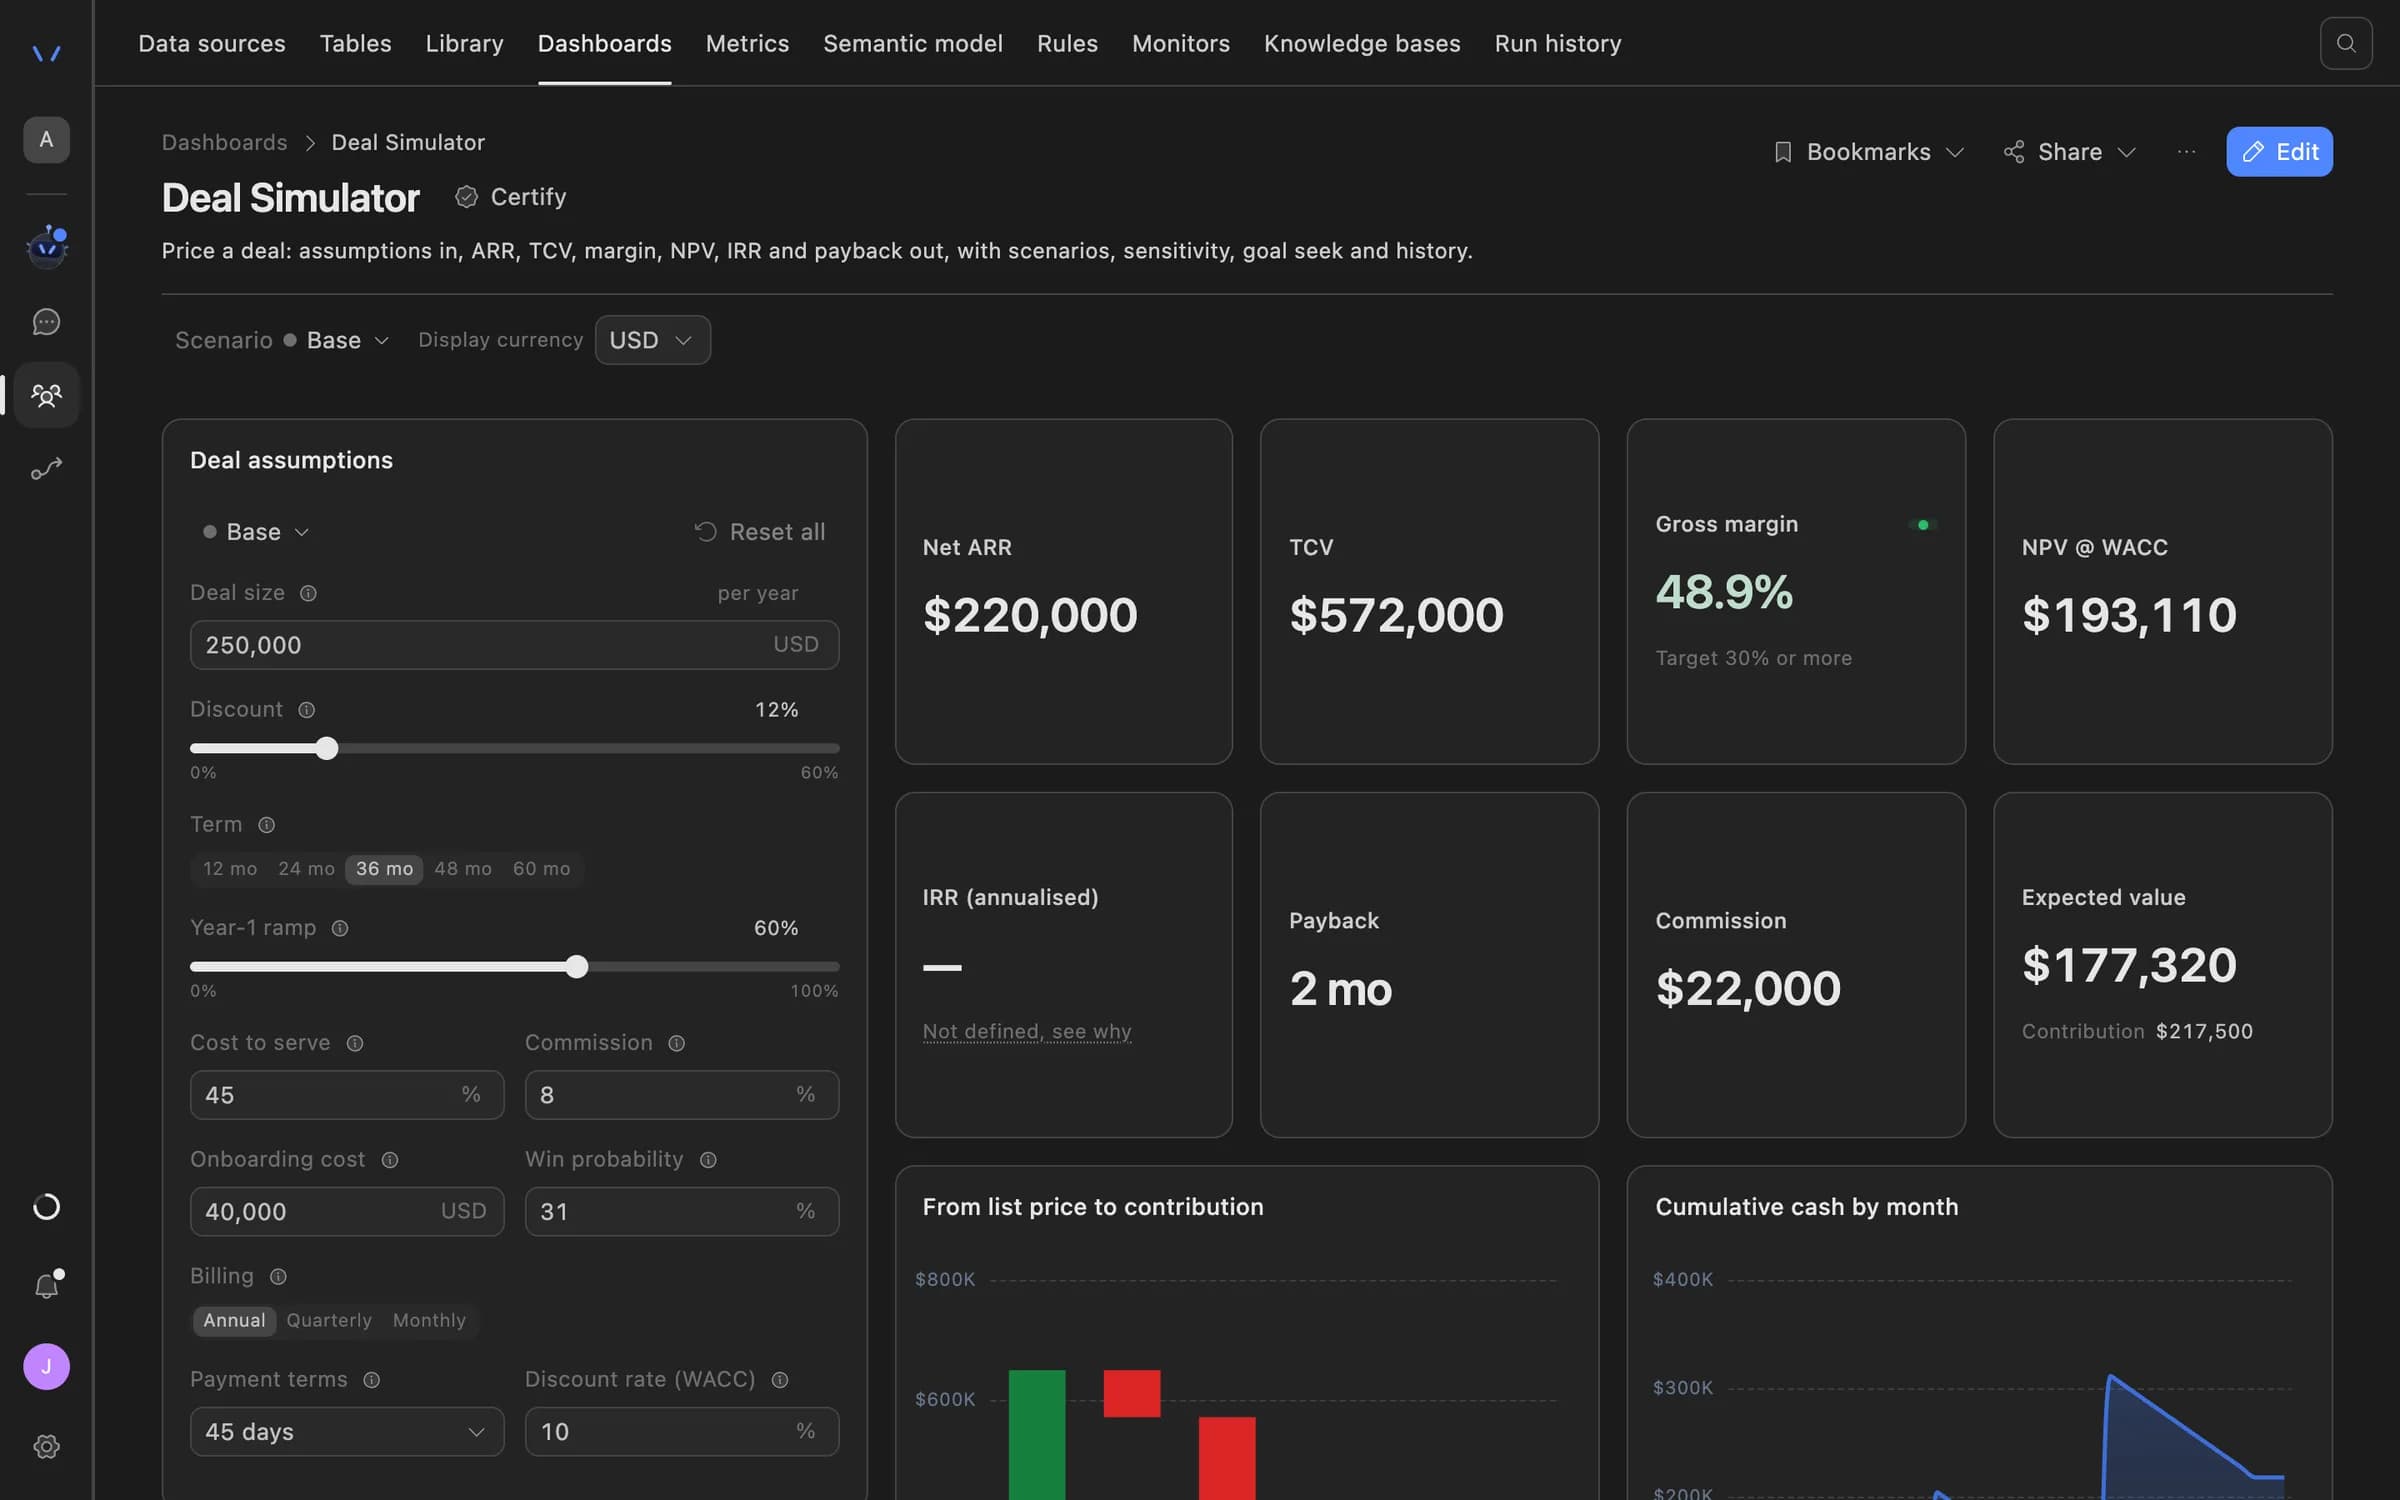
Workbench scenarios in Agent Serve recalculate outcomes as you change assumptions, and stay separate from recorded results.

  • Change size, discount, term or cost to serve
  • See the outcome recalculate as you type
  • Recorded results stay untouched
Agent Serve Deal Simulator: deal assumptions such as size, discount, term and cost to serve on the left, with net ARR, TCV, gross margin, NPV, payback and commission recalculated on the right.
04 · Call compliance

Score calls beside the charts

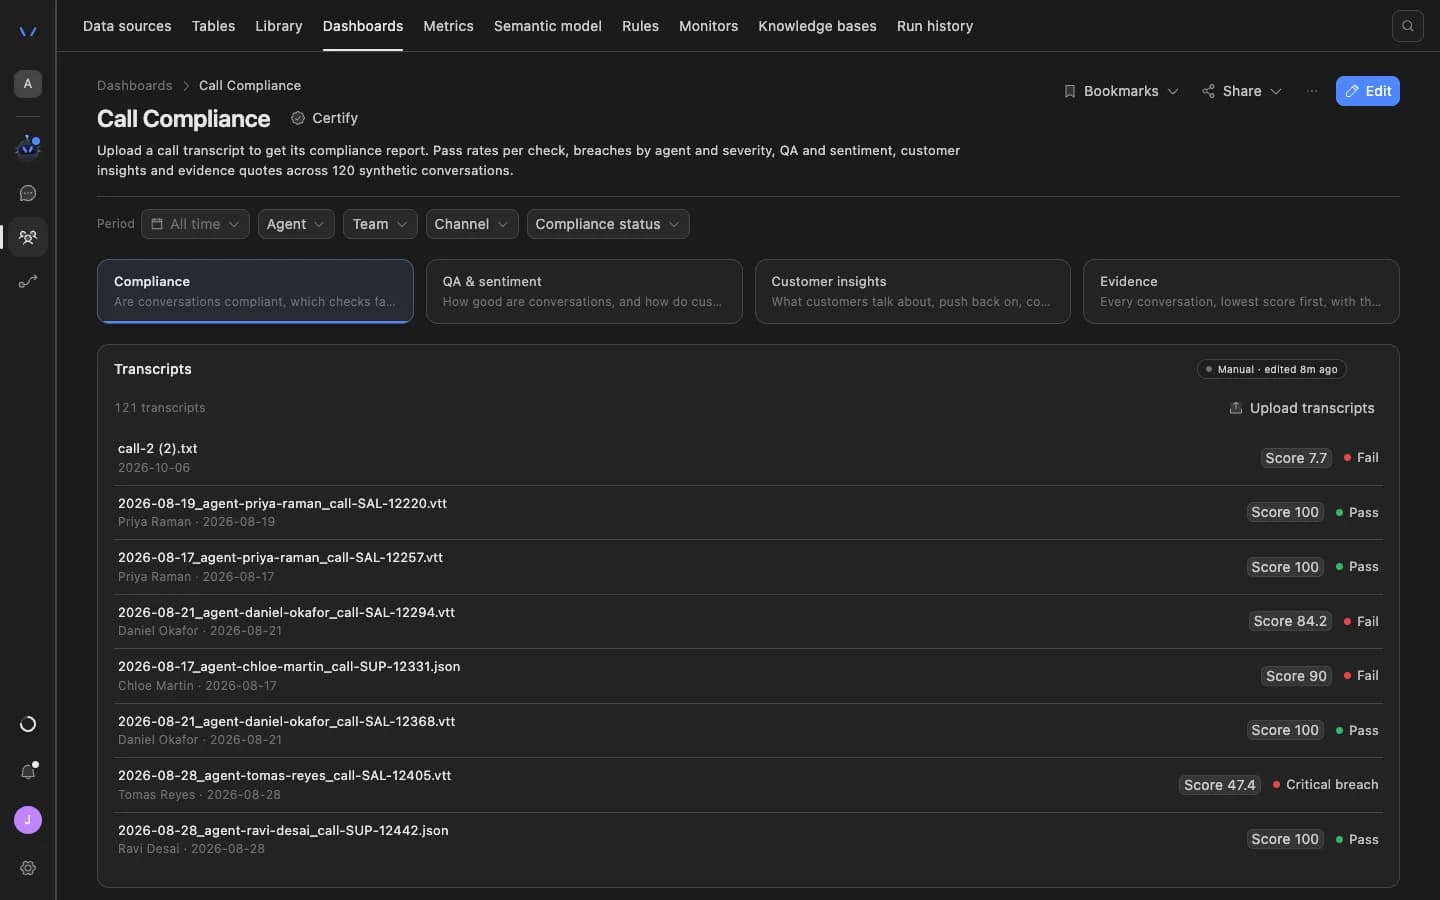
The Agent Serve Transcript upload panel scores each call against your checks, and the Call Compliance template lays out the review.

  • Filter by period, agent, team and channel
  • Each transcript gets a score and a pass or fail
  • Tabs for QA, sentiment and evidence
The Agent Serve Call Compliance dashboard: filters for period, agent, team, channel and compliance status, tabs for compliance, QA and sentiment, customer insights and evidence, and a list of uploaded transcripts each with a score and a pass or fail result.
05 · Evidence

The reason for every result

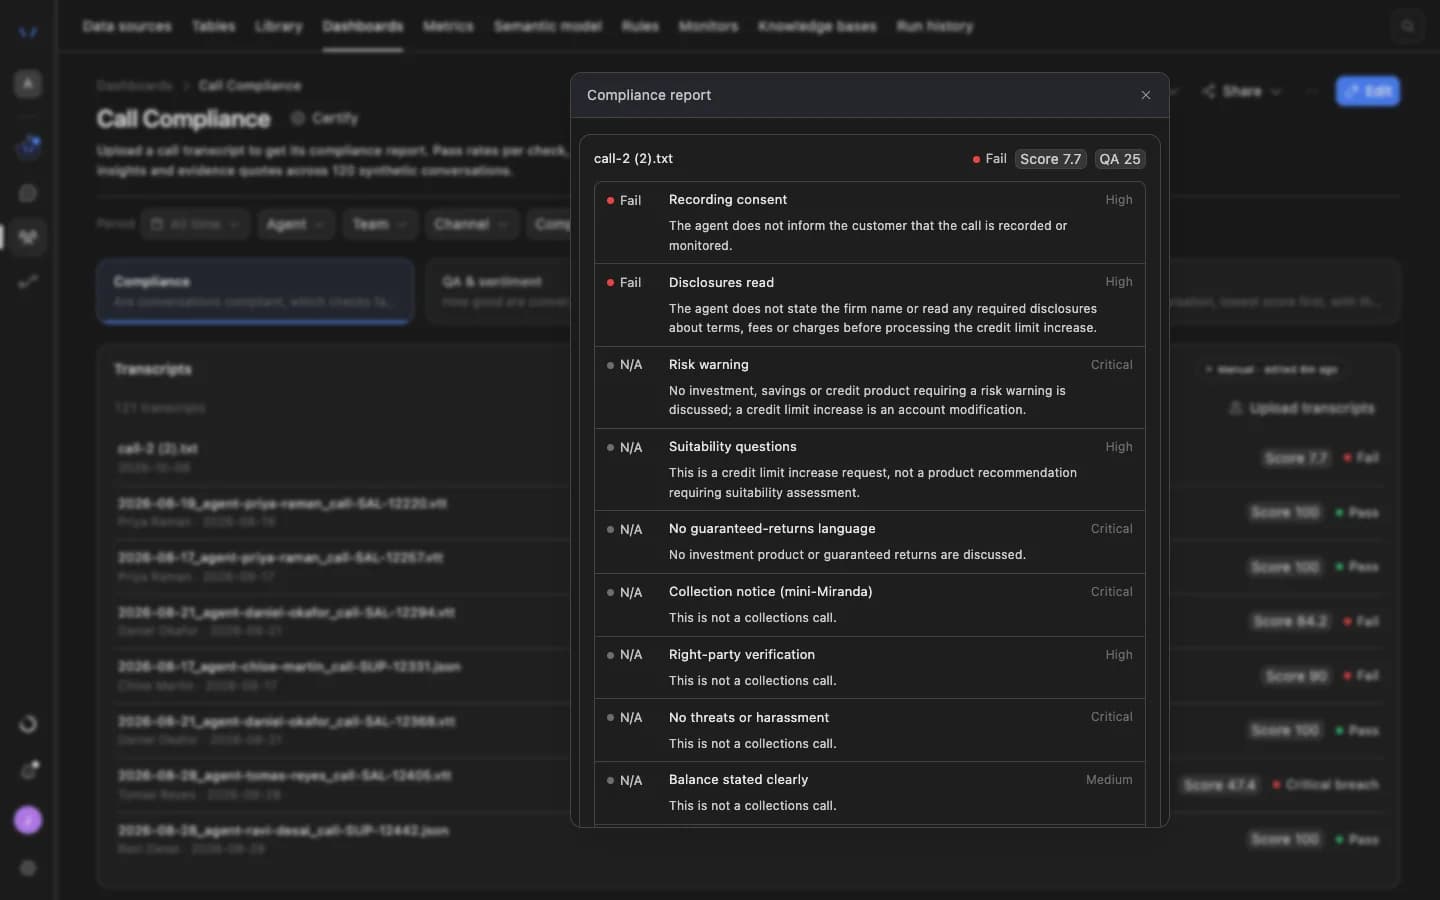
Open one call in Agent Serve to see each check, such as recording consent or a risk warning, with its severity and the reason in plain language.

  • Fail, pass or not applicable per check
  • Severity on every finding
  • A breach rule decides what counts as a breach
An Agent Serve compliance report for one call transcript: each check, such as recording consent, disclosures read and risk warning, marked Fail or N/A with its severity and the reason in plain language.

By the numbers

Room for the whole board pack.

Panels per dashboard

120

Panels per dashboard

Chart types in the component library

20

Chart types in the component library

Filter types, from date range to hierarchy

9

Filter types, from date range to hierarchy

Recipients per scheduled report

50

Recipients per scheduled report

Limits are set in the product per dashboard.

Explore

Every panel kind a review needs.

Twenty chart types

Agent Serve charts include line, bar, combo, dual axis, funnel, waterfall, Sankey, heatmap, box plot and gauge.

Waterfall · Net interest income bridge

Tables, pivots and cards

Agent Serve panels also come as tables, pivots, metric tiles, cards, text and section headers on a 12-column grid.

Pivot · Exposure by sector × rating

Maps and geo

Agent Serve maps plot points, bubbles, clusters, heat and regions, and a rule can colour each region.

Region map · Branch NPS

Filters in plain words

Agent Serve has nine filter types, from date range to measure and hierarchy, plus an AI filter box that turns a sentence into filters.

“Large accounts in EMEA last quarter”

Themes for every audience

Agent Serve has nine theme presets, including High contrast, Colour-blind safe and Print.

Theme · Colour-blind safe

Versions and bookmarks

Agent Serve keeps every version of a dashboard, compares it with the previous one, restores an older one, and saves bookmarks of a filtered view.

v12 → Restore this version

Share

Share with intention. Not with everyone.

Choose the audience, an expiry, export permissions and locked filters before a dashboard leaves your hands.

Examples

What banks and insurers put on a dashboard.

Three dashboards financial services teams build on Agent Serve, each replacing a pack someone assembled by hand.

Credit risk

Credit committee pack

An Agent Serve dashboard shows exposure, watch-list movements and new limits, and arrives as a PDF before every committee.

  1. Governed metrics
  2. Exposure panels
  3. Filters locked
  4. PDF every Monday
Retail banking · Branches

Branch performance

Regional heads open an Agent Serve region map of branch results, drill into one branch, and see only the rows their role allows.

  1. Region map
  2. Drill to branch
  3. See rows
  4. Row-level security
Contact centre · Compliance

Call compliance review

Quality teams upload call transcripts to an Agent Serve Transcript upload panel and review each failed check with its reason.

  1. Transcripts uploaded
  2. Checks scored
  3. Fails filtered
  4. Evidence reviewed

Examples show what teams can build in Agent Serve. They describe patterns, not named customer deployments.

Under the hood

Agent Serve Dashboards, in detail.

Agent Serve Dashboards, in detail.
Panel typesChart, table, metric, text, map, pivot and cards, on a 12-column grid.
Limits per dashboard120 panels, 24 filters, 20 views and 16 parameters.
FiltersSelect, date range, text, number range, boolean, condition, top N, measure and hierarchy, plus the AI filter box.
DrillDown and up through as many as six levels, drill-through to another view, and See rows.
ExportsPDF of one or all views (A4 or US Letter, landscape or portrait), PNG, print, and CSV per panel.
Scheduled reportsDaily, weekly or monthly at a set time and time zone, as PDF, PNG or a link. Up to 50 recipients and 25 subscriptions per dashboard.
TemplatesExecutive overview, Revenue trend, Pipeline tracking, Customer segmentation, Geographic analysis, Operational metrics, Product performance, Support tickets and Call Compliance.
AI assistanceDescribe with AI, up to four panel proposals per request, narratives and Explain chart.

Governance

Numbers people can rely on.

Agent Serve decides who sees which rows, what leaves a shared dashboard, and which dashboards the team should trust.

Security and governance
  • Row-level security

    Agent Serve row policies decide which rows each person sees. Preview a dashboard as another role before you share it.

  • Locked filters and audience

    Agent Serve viewer links go to approved email addresses, a password or anyone with the link, with an expiry and filters locked on the server.

  • Export you allow

    Allow data export is on or off for each Agent Serve viewer link, and the link’s view count is tracked.

  • Certified dashboards

    Certify the Agent Serve dashboards your team should rely on, so readers know which version is the reference.

  • Row-level access

    Row-level policies narrow what each person sees in tables, dashboards, exports and scheduled reports.

  • Roles and permission groups

    Admin, write and read roles per workspace, plus permission groups that limit which models, blocks and integrations a team can use.

  • SSO and SCIM

    Sign in through your identity provider with SAML 2.0 or OIDC, and provision people with SCIM.

  • Self-hosting

    Run Agent Serve in your own cloud or data centre, next to the systems it reads.

Before and after

Fewer packs, fewer arguments about numbers.

Fewer packs, fewer arguments about numbers.
WorkBeforeWith Agent Serve
Metric definitionsBeforeEach report recalculates win rate or margin its own way.With Agent ServePanels reference one governed metric, so every Agent Serve view agrees.
Answering “why”BeforeA new data request for every follow-up question.With Agent ServeDrill down, drill through or open See rows on the panel itself.
The weekly packBeforeScreenshots pasted into slides and emailed by hand.With Agent ServeA scheduled PDF to up to 50 recipients, at a set time and time zone.
Sharing outside the teamBeforeExports that show every row to everyone who opens them.With Agent ServeViewer links with an audience, an expiry, locked filters and row-level security.

Works with

What feeds a dashboard, and what it starts.

Further reading

Solutions built on Agent Serve Dashboards.

Questions

About Dashboards

How are dashboards connected to the rest of Agent Serve?

Agent Serve dashboards use workspace data, governed metrics and rules. The semantic model describes how sources connect, and monitors follow metrics after a dashboard is built.

Can people see different rows on the same dashboard?

Yes. Agent Serve row-level security policies decide which rows each person can see, and you can preview a dashboard as another role before sharing it.

Can a dashboard be sent on a schedule?

Yes. Subscribe in Agent Serve sends a dashboard daily, weekly or monthly at a set time and time zone, as a PDF, a PNG or a link, to up to 50 recipients.

Can I build a panel by describing it?

Yes. Describe the panel in Agent Serve and choose from up to four proposals built on your governed metrics, then adjust it like any other panel.

What can people outside the team see?

Only what the Agent Serve viewer link allows: the audience you chose, until its expiry, with locked filters enforced on the server and export on or off.

Last updated

Enterprise access

Put AI agents to work across your team

Agent Serve is available to teams by invitation. Tell us what you want to build and we will set up your workspace with you.