Aggregate
An Agent Serve aggregate metric reduces one column with sum, average, min, max, count, count distinct or median.
Total premium = sum(premium)
Agent Serve · Metrics
Define net revenue, loss ratio or win rate once in Agent Serve. Every dashboard and monitor that uses it shows the same figure.
Agent Serve Metrics is the shared metric library of Agent Serve, the AI workspace where teams build, deploy, and manage AI agents. Teams define aggregate, weighted, ratio and calculated metrics over workspace tables, with a description, format and unit, then reuse each one in dashboards, monitors and the semantic model so every view computes the number the same way.
How it works
An Agent Serve metric sits between your tables and every chart, so the calculation is written once.
Choose a workspace table and the column to measure.
Aggregate, weighted, ratio or calculated, with sum, average, count, median and more.
Add the business definition, a format of number, currency or percent, and a unit.
Put the metric on a dashboard panel, watch it with a monitor, or link it from the semantic model.
Metric kinds
An Agent Serve aggregate metric reduces one column with sum, average, min, max, count, count distinct or median.
Total premium = sum(premium)
An Agent Serve weighted metric multiplies a value by a weight, as a weighted average or a weighted total.
Average rate weighted by balance
An Agent Serve ratio metric divides one metric by another, and can display the result as a percent.
Win rate = won ÷ closed
An Agent Serve calculated metric combines other metrics in a formula, so derived measures stay in step.
Net margin = revenue − cost
In depth
Agent Serve computes a metric with the same server-side query wherever it appears, so a dashboard tile and a monitor see the same number.
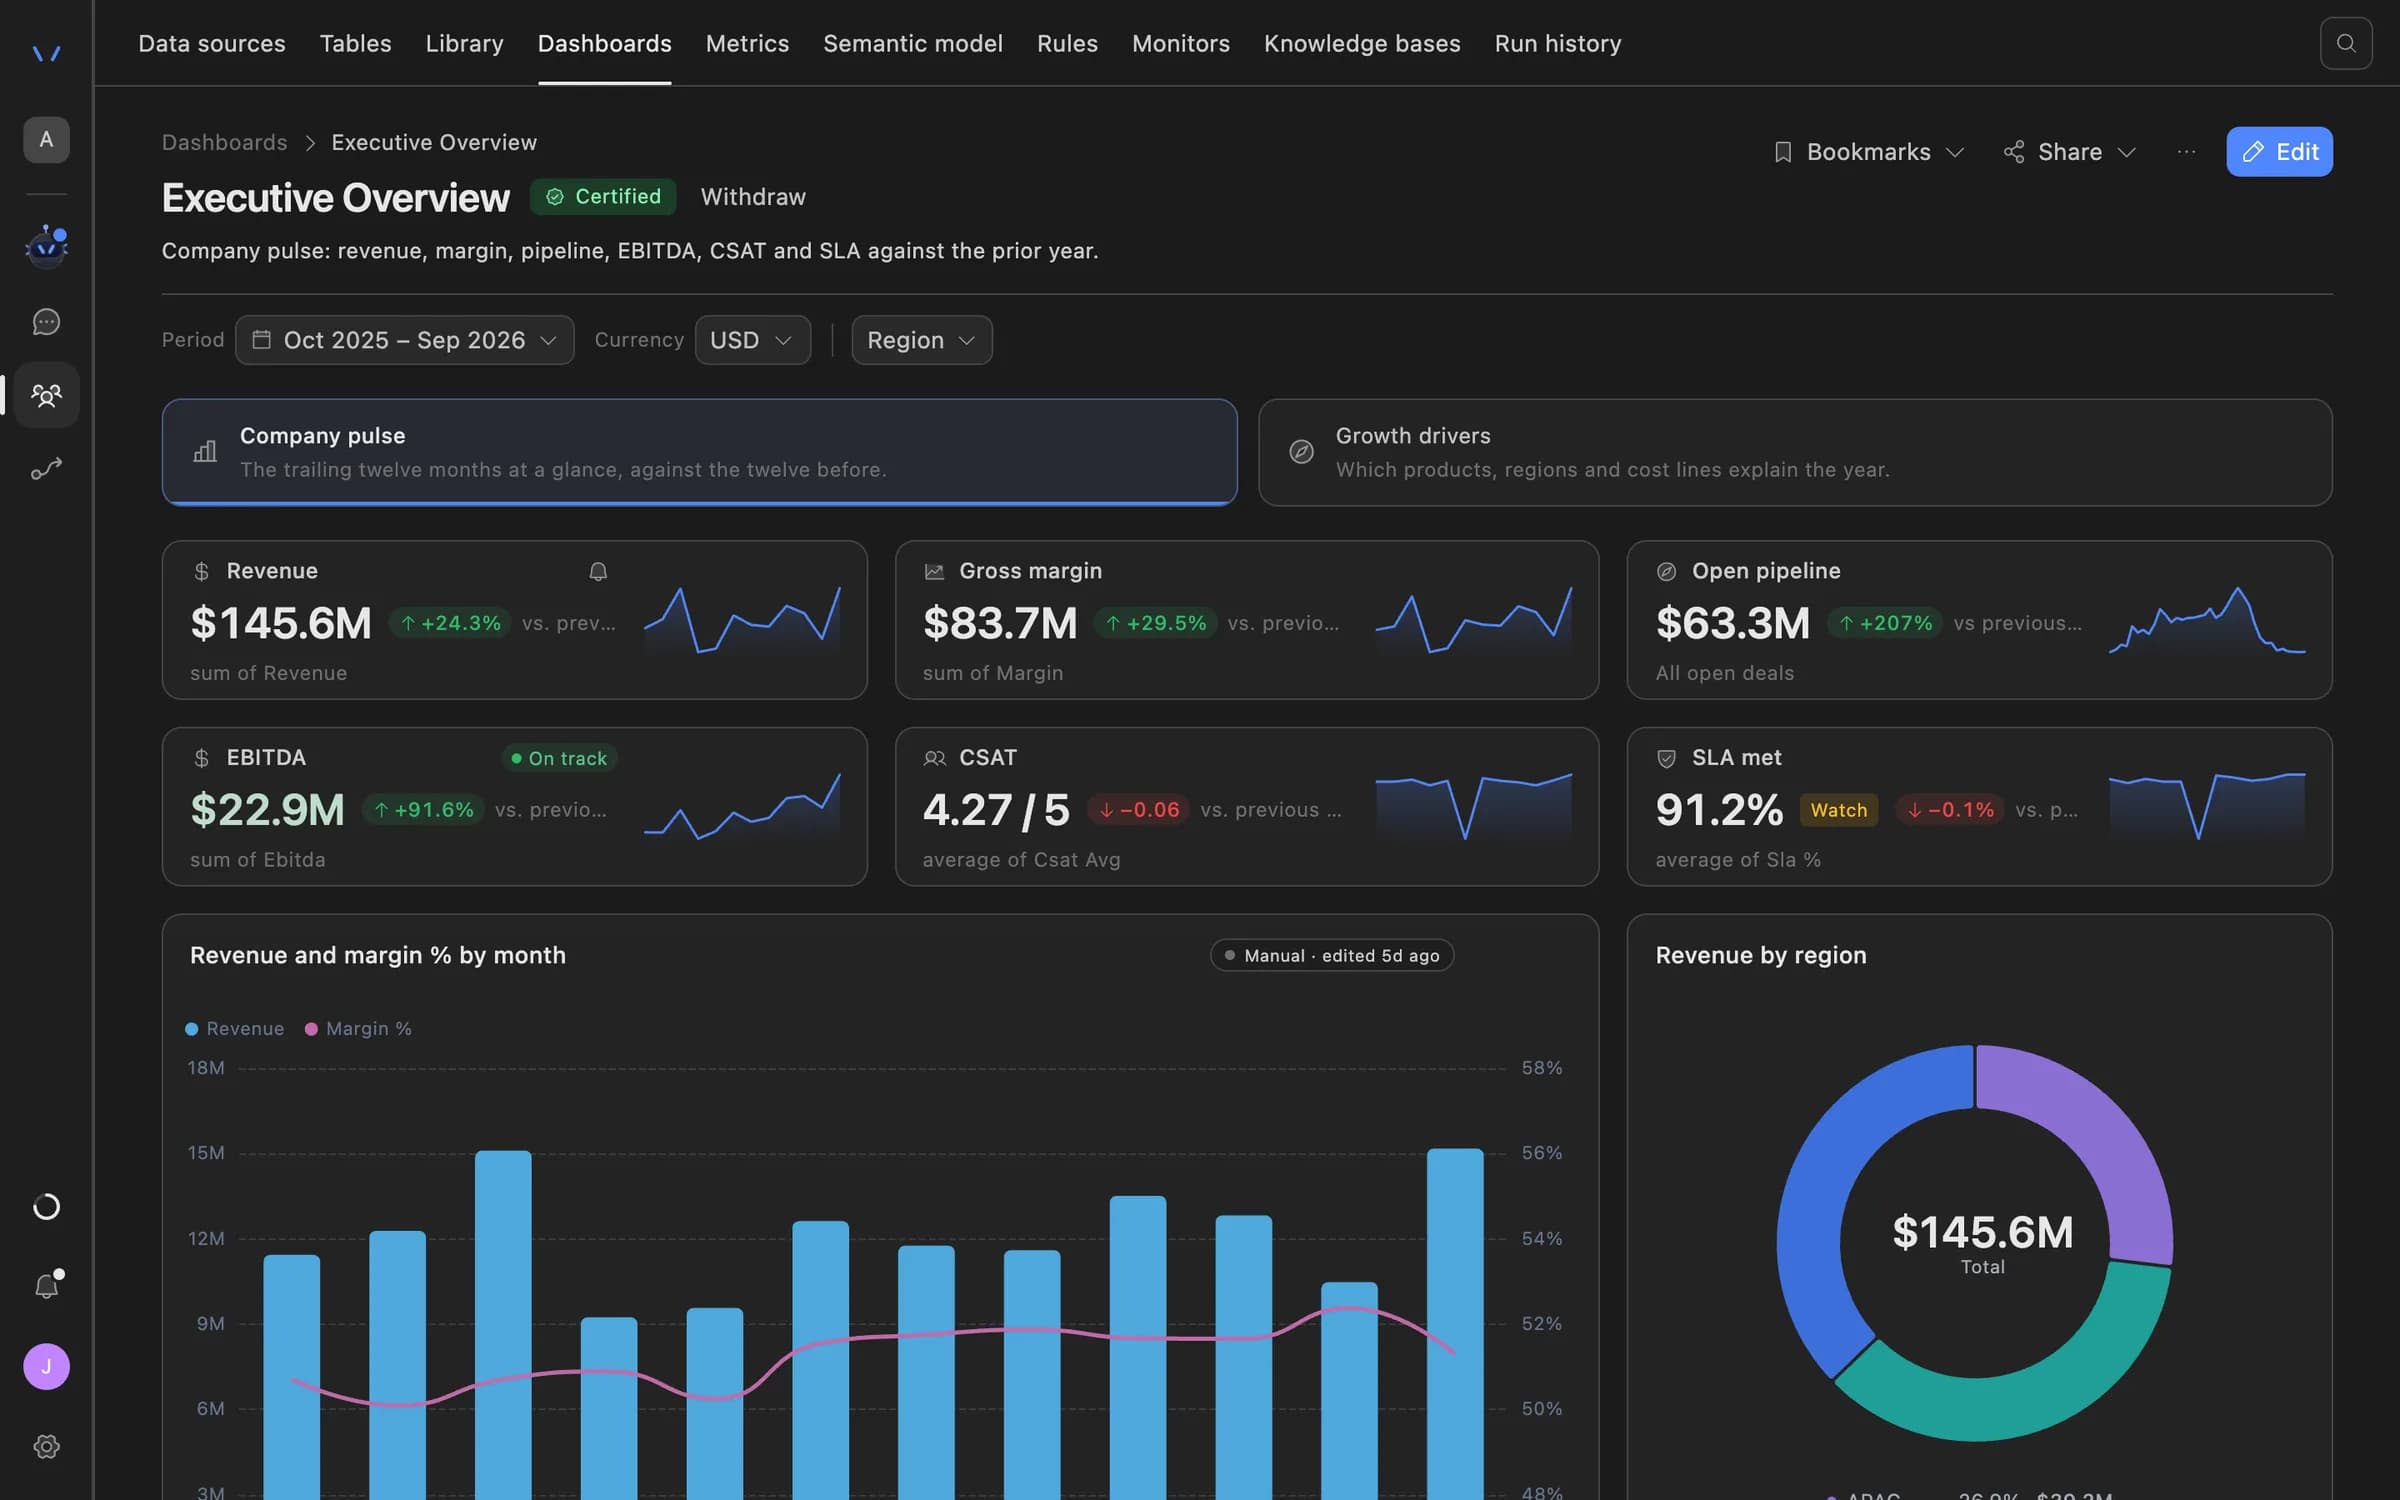
Agent Serve dashboard panels show a metric as a value with its trend, using the metric’s own format and unit.
An Agent Serve monitor can watch a metric and flag when it crosses the line you set.
An entity in the Agent Serve semantic model can link a measure to a metric, so analysis in business terms uses the governed number.
Examples
Three metrics financial services teams keep in Agent Serve.
An Agent Serve ratio metric divides claims paid by earned premium and shows it as a percent on every claims dashboard.
An Agent Serve weighted metric averages the interest rate by outstanding balance, so a few small loans never skew the figure.
An Agent Serve calculated metric divides open pipeline by quota, and a monitor watches it each week.
Examples show what teams can build in Agent Serve. They describe patterns, not named customer deployments.
Before and after
| Work | Before | With Agent Serve |
|---|---|---|
| Where the formula lives | BeforeInside each chart, written slightly differently every time. | With Agent ServeIn one Agent Serve metric that every panel and monitor reads. |
| Changing a definition | BeforeHunt down every report that uses the old formula. | With Agent ServeEdit the metric once, and every place that uses it follows. |
| What a number means | BeforeAsk the analyst who built the report. | With Agent ServeRead the description saved with the metric. |
By the numbers
4
Metric kinds: aggregate, weighted, ratio, calculated
7
Aggregations, from sum to median
3
Formats: number, currency, percent
500
Metrics per team space
Figures are read from the product code.
Under the hood
| Where it lives | The Metrics tab in Team spaces, beside Dashboards. |
|---|---|
| Fields | Name, description, metric type, table, column, format and unit. |
| Aggregations | Sum, Average, Min, Max, Count (rows), Count distinct and Median. |
| Weighted | Weighted average, Σ(v×w) / Σw, or weighted total, Σ(v×w). |
| Used by | Dashboard panels, monitors and the semantic model. |
| Checks | Names are unique per team space, and a metric cannot reference one that is missing. |
| Delete | Archived rather than erased. |
Governance
Agent Serve keeps metric definitions under the team space’s roles, and records each new metric in the audit log.
Security and governanceCreating or editing an Agent Serve metric needs admin or write access to the team space.
Agent Serve writes each new metric to the audit log, so you can see who added a definition.
Admin, write and read roles per workspace, plus permission groups that limit which models, blocks and integrations a team can use.
Row-level policies narrow what each person sees in tables, dashboards, exports and scheduled reports.
Proposals, approvals, declines and executed actions are written to the workspace audit log, which admins can export.
Works with
Further reading
Disputes that fail reconciliation tend to sit in a side queue until the chargeback window has closed. Here is an end-to-end setup that finds them early, ranks them by deadline and drafts the pack, with an analyst signing every filing.
Cards and payments operations · 12 min readPeriodic reviews pile up because every file starts from scratch, even when nothing has changed. Here is a setup that refreshes the data, drafts the file and routes it by risk, so analysts spend their time on the reviews that need judgement.
Retail and business banking · 12 min readSampled call reviews find a missing risk warning weeks after the client acted on the advice. Here is a setup that checks every recorded advice call within a day and puts the quote in front of a compliance reviewer.
Wealth and advice · 12 min readQuestions
An Agent Serve metric is a named, described calculation over a workspace table, such as a sum, a weighted average or a ratio, that dashboards and monitors reuse.
Agent Serve supports aggregate, weighted, ratio and calculated metrics. Aggregates use sum, average, min, max, count, count distinct or median.
Not today. Agent Serve keeps the current definition of each metric, and archives a metric when it is deleted.
The Agent Serve semantic model describes entities and how they connect. An entity’s measure can link to a metric, so both use the same calculation.
Last updated
Enterprise access
Agent Serve is available to teams by invitation. Tell us what you want to build and we will set up your workspace with you.